How to Analyze a Stock Before You Invest
Investing in stocks can be one of the most effective ways to grow wealth over time. However, picking the right stock requires careful evaluation and analysis to minimize risks and maximize returns. Understanding how to analyze a stock before investing not only helps protect your capital but also empowers you to make informed decisions based on facts, trends, and metrics rather than emotions or hearsay.
In this detailed guide, we will explore the core techniques and metrics investors use to evaluate stocks. By combining fundamental analysis, technical insights, and market conditions, you can holistically assess a company’s value and future growth potential. Real-world examples and comparative data will highlight common pitfalls and best practices to ensure your stock investments are sound.
Understanding Financial Statements: The Foundation of Stock Analysis
One of the first steps in analyzing a stock is reviewing the company’s financial statements. These documents provide critical information about a company’s profitability, liquidity, and financial stability.
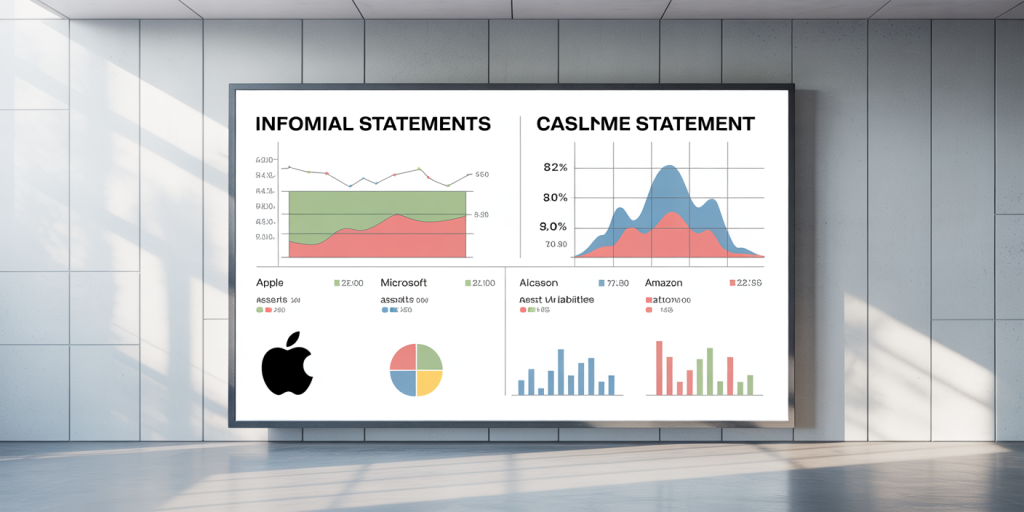
The three key financial statements are the income statement, balance sheet, and cash flow statement. The income statement reveals the company’s revenues, expenses, and net profit over a period, helping investors assess operational efficiency. For instance, Apple Inc.’s income statement for FY 2023 showed a 12% increase in net income to $99.8 billion, illustrating strong profitability despite economic headwinds.

Next, the balance sheet details the company’s assets, liabilities, and shareholder equity at a given date, offering insight into financial strength. A strong balance sheet with manageable debt levels is preferable, especially during market turbulence. For example, Microsoft maintains a debt-to-equity ratio of 0.45, indicating moderate use of debt in financing operations.
Lastly, the cash flow statement tracks the actual cash generated and used in operations, investing, and financing activities. Free cash flow, which is the cash left after capital expenditures, indicates the company’s capacity to reinvest or return cash to shareholders. Amazon’s robust free cash flow of $34 billion in 2023 underscores its ability to fund expansion while maintaining financial health.
Together, these statements provide a comprehensive snapshot that aids investors in understanding the company’s current financial position and trends over time.
Key Financial Ratios: Benchmarking Company Performance
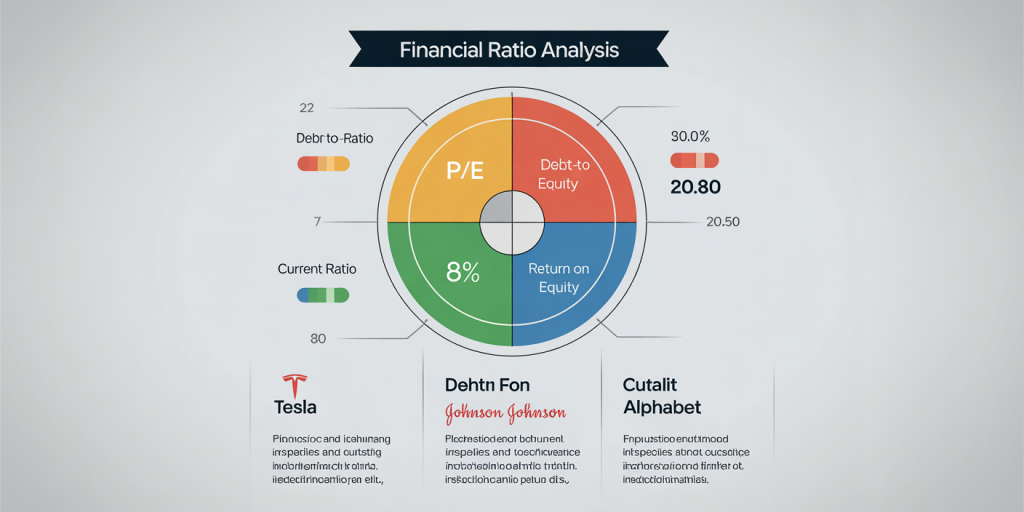
Financial ratios distill complex data from financial statements into digestible indicators that benchmark a company’s performance against peers and industry standards. Here are some critical ratios to consider: Price-to-Earnings (P/E) Ratio: Measures how much investors are willing to pay per dollar of earnings. A high P/E, like Tesla’s 50+ in 2023, may indicate growth expectations but could also signal overvaluation. Conversely, a low P/E might suggest undervaluation or underlying problems. Debt-to-Equity Ratio: Shows the relative proportion of company debt to shareholder equity. Companies with lower ratios, such as Johnson & Johnson’s 0.35, typically carry less financial risk. Return on Equity (ROE): Indicates how efficiently the company generates profits from shareholders’ equity. ROEs above 15%, like Alphabet’s 18% in 2023, often reflect efficient management. Current Ratio: Measures short-term liquidity by comparing current assets to liabilities. A ratio above 1.5 offers a safety margin, but an extremely high ratio can imply idle capital.

| Financial Ratio | Definition | Ideal Benchmark | Example: Apple (2023) | Example: Tesla (2023) |
|---|---|---|---|---|
| Price-to-Earnings (P/E) | Market price per share divided by EPS | 15 – 25 for mature stocks | 28 | 52 |
| Debt-to-Equity | Total liabilities divided by equity | 0.3 – 1.0 | 1.5 | 1.7 |
| Return on Equity (ROE) | Net income divided by shareholder equity | > 15% | 35% | 7% |
| Current Ratio | Current assets divided by current liabilities | 1.5 – 3 | 1.2 | 1.1 |
Comparing these ratios within the industry context can help identify opportunities or red flags effectively.
Evaluating Industry Position and Competitive Advantage
A company’s market position and sustainable competitive advantage — also known as its “moat” — significantly impact future success. An investor should understand how the company fares amongst competitors and the broader industry environment.
For example, Coca-Cola has a wide moat built on brand recognition, global distribution networks, and customer loyalty. This has allowed it to maintain consistent revenue growth despite intense market competition. Conversely, companies in highly fragmented industries such as apparel retail often face pressure on margins and market share.
Market share data can offer further insight. For instance, in the smartphone streaming war, Apple’s iPhone captured about 21% of global market share in 2023, while Samsung held 18%, and emerging brands like Xiaomi continued rapidly growing. These dynamics influence pricing power and growth potential.

Another factor is vulnerability to macroeconomic shifts. Utilities companies like NextEra Energy benefit from stable demand, but tech startups may be more sensitive to interest rate increases or supply chain disruptions—as seen during the 2022 inflation surge.
Understanding competitive positioning also involves qualitative analysis: management expertise, innovation capability, customer satisfaction, and regulatory environment are key considerations.
Technical Analysis: Reading Stock Price and Volume Trends
While fundamental analysis looks at a company’s intrinsic value, technical analysis studies stock price movements and trading volumes to gauge investor behavior and market sentiment.
Technical indicators such as moving averages, Relative Strength Index (RSI), and Bollinger Bands help spot trends and potential entry or exit points. For example, if a stock price breaks above its 50-day moving average with increasing volume, it can signal bullish momentum.
Consider the case of Netflix in early 2023. After a period of sideways movement, Netflix’s stock surged 15% within two weeks as it broke out above resistance levels accompanied by high trading volume, indicating renewed investor confidence after positive earnings.
Chart patterns, like head and shoulders or double bottoms, can also predict trend reversals. Many traders combine these techniques with fundamental insights to time buys and sells more effectively.
However, it’s important not to rely solely on technical analysis, particularly for long-term investors. Instead, use it as a complementary tool to verify or challenge fundamental conclusions.
Real-World Example: Comparing Amazon and Walmart Before Investing
To illustrate the importance of thorough stock analysis, consider Amazon and Walmart, two giants in retail but with different business models and financial profiles.
| Aspect | Amazon (2023) | Walmart (2023) |
|---|---|---|
| Market Capitalization | $1.6 trillion | $470 billion |
| Revenue Growth (YoY) | 12% | 2% |
| Net Profit Margin | 5% | 3.5% |
| Debt-to-Equity | 0.44 | 0.63 |
| P/E Ratio | 45 | 20 |
| Free Cash Flow | $34 billion | $18 billion |
| Competitive Advantage | Leading e-commerce platform & AWS | Massive physical network & brand |
Amazon’s higher growth rates and margins highlight its aggressive expansion and dominance in cloud computing. Walmart, with lower growth but strong cash flow and steady profits, represents a value-oriented approach with less volatility.
Investors seeking growth might favor Amazon despite its higher valuation and risks. Meanwhile, conservative investors might prefer Walmart’s stability. This comparative analysis demonstrates how blending financial metrics with business models enables tailored investment decisions.
The Role of Market Sentiment and Macro Trends in Stock Analysis
Stock prices are influenced not only by company fundamentals but also by market sentiment and macroeconomic factors. Changes in interest rates, inflation, geopolitical risks, and global events can drive volatility.
For instance, in 2022, rising inflation and Federal Reserve interest rate hikes pressured growth stocks disproportionately, causing tech-heavy indices like the NASDAQ to lose over 30%. Conversely, sectors like energy and commodities surged.
Monitoring macro trends can help investors anticipate sector rotation and adjust portfolio exposure. For example, during economic recoveries, cyclical stocks in industries such as manufacturing and financial services often outperform defensive sectors like utilities or consumer staples.
Sentiment indicators such as the Volatility Index (VIX) or investor surveys also signal market mood. A spike in the VIX typically suggests increased fear and selling pressure, potentially offering buying opportunities for savvy investors.
Understanding these external forces complements company-based analysis, allowing investors to navigate changing market environments more skillfully.
Looking Ahead: Future Perspectives in Stock Analysis
The landscape of stock analysis continues evolving with advancements in technology and data availability. Artificial intelligence (AI) and machine learning models are increasingly integrated into stock screening and predictive analytics, enabling deeper pattern recognition and automation.
For example, hedge funds and financial institutions are leveraging AI algorithms to analyze vast datasets, including alternative data such as satellite images, social media sentiment, and consumer behavior trends for investment decisions.
Additionally, environmental, social, and governance (ESG) factors are becoming vital components of analysis. Investors are increasingly prioritizing companies with strong sustainability credentials, which can impact long-term performance and risk.
Moreover, the rise of real-time data platforms and mobile trading apps offers retail investors unprecedented access to analytical tools previously available only to professionals.
Future investors should harness these innovations alongside traditional analysis methods to keep pace with complex and fast-evolving markets. Emphasizing a balanced approach that integrates quantitative data, qualitative judgement, and macro awareness will remain key to successful investing.
In summary, analyzing a stock before you invest involves examining financial health, comparing key ratios, understanding competitive advantages, applying technical signals, and accounting for market conditions. By diligently combining these elements and learning from real-world examples, investors can build smarter portfolios designed to grow sustainably over time.
